SKP RESOURCES BHD


Indicator has issued a BUY Signal, while the RSI has risen above 50. Price may advance, targeting the
RM1.63- - RM1.75 levels. Support will be pegged around the RM1.34 level
source: Malacca Securities Research – 11/07/2018
Indicator has issued a BUY Signal, while the RSI has risen above 50. Price may advance, targeting the
RM1.63- - RM1.75 levels. Support will be pegged around the RM1.34 level
source: Malacca Securities Research – 11/07/2018
source: Kenanga Research – 04/07/2018
SCICOM could be riding on the healthy tourist growth (11.8% in 2017) in Cambodia, following the award of contract from Ministry of Tourism of Cambodia. SCICOM has a net cash of RM45.8m (12.9 sen/share) as of end March 2018 and its dividend yield stood at 4.5%. The share price suggests that SCICOM has experienced a symmetrical triangle breakout above RM2.00, accompanied by healthy volumes. Upside will be pegged around RM2.29- RM2.40, followed by a LT target of RM2.50. Support will be located around RM1.84-1.90, with a cut loss at RM1.80.
Figure #1 Weekly chart: Hovering above weekly SMA200:
Company profile. Scicom (MSC) Berhad (SCICOM) is engaged business process outsourcing (BPO), which features four core segments, namely (i) Customer Lifecycle Management, (ii) Education solutions, (iii) e-Commerce Solutions and (iv) e- Government services. At this juncture, the integrated solutions company has 64% of revenue generated from Malaysia, while the rest are registered internationally (Singapore, Philippines, Thailand, Sri Lanka and China).
Figure #2 Daily chart: Symmetrical triangle breakout above RM2.00
Cambodia tourism management system project. SCICOM has been awarded a project by the Ministry of Tourism of Cambodia to develop, implement, operate and maintain a fully integrated Cambodia Tourism Management System for a period of five years with an extension option of two years. The expected revenue from this contract is dependent on the number of air travellers to and from Cambodia. SCICOM commented that it will not have any effect on its earnings until FY19. We believe the project is positive for SCICOM, judging from the healthy growth of 11.8% in 2017 of international tourist arrivals to Cambodia (Figure #3).
Net cash, decent dividend yield and compelling ROE. SCICOM has a net cash position of RM45.8m (12.9 sen/share) as of end March 2018 and its dividend yield stood at 4.5%. We believe given its expertise within the e-Solutions services would be able to maintain its compelling ROE of 34%, while continue to reward the shareholder with its healthy cash position. Despite the potential downside risk towards its current domestic, following the recent changes in Malaysia’s political scene, we believe the outlook remains positive supported by the international BPO clients as well as the project from Cambodia.
Figure #3 International tourist arrival to Cambodia (2012-2017)
Symmetrical triangle pattern breakout. SCICOM rallied since February 2018 from the RM1.68 level towards the 2018 peak of RM2.14 in March. Since then, it has been consolidating sideways within a symmetrical triangle formation over the past four months. We opine the uptrend remains intact as the prices are hovering the weekly SMA20 and above the daily SMA200 and volumes have been picking over the past two days with the price surging above the RM2.00 (trendline). We anticipate that the share price could retest the all-time-high of RM2.29, followed by RM2.40 as well as a LT target of RM2.50. Support will be pegged around RM1.84-1.90, with a cut loss set
below RM1.80.
source: HLIB Retail Research – 27 June 2018
● Target Price RM1.30
● Last closing price RM1.12
● Potential return 16.0%
● Support RM1.05
● Stop Loss RM0.950
Possible upside. KOBAY is showing signs of recovery from recent major pullback. Improving RSI and MACD indicators currently signal reasonable entry level, with anticipation of continuous improvement in both momentum and trend in near term. Should resistance level of RM1.13 be genuinely broken, it may continue to lift price higher to subsequent resistance level of RM1.30. However, failure to hold on to support level of RM1.05 may indicate weakness in the share price and hence, a cut-loss signal.
source: PublicInvest Research - 18/04/2018
DAYANG ENTERPRISE HOLDINGS BHD Stock Code 5141

Target Price RM0.890
Last closing price RM0.800
Potential return 11.2%
Support RM0.750
Stop Loss RM0.720
Possible for further upside. DAYANG’s price is recovering from pullback. Improving RSI and MACD indicators currently signal reasonable entry level, with anticipation of continuous improvement in both momentum and trend in near term. Should resistance level of RM0.835 be broken, it may continue to lift price higher to subsequent resistance level of RM0.890.
However, failure to hold onto support level of RM0.750 may indicate weakness in the share price and hence, a cut-loss signal.
source: Public Bank Research – 13/03/2018

ANN JOO RESOURCES BHD Stock Code: 6556
• Yesterday, ANNJOO gained an impressive 22 sen (6.4%) to close at intraday high of RM3.63.
• Yesterday’s move marked a first breakthrough from a two-month period of consolidation.
• Uptick in MACD to crossover its Signal-line, coupled with the share price closing above its 20-day SMA for the first time in two months could signal a bullish turn in its technical picture.
• From here, watch out for an immediate overhead resistance at RM3.98 (R1), the all-time high, with a higher resistance at RM4.41 (R2).
• Downside supports can be found at RM3.29 (S1) and RM3.08 (S2).
source: Kenanga Research – 14/02/2018
ANN JOO RESOURCES BERHAD
The principal activity of the Company is investment holding. The principal activities of its subsidiaries are property management and management services Trading retailing importing exporting and supplying of all kinds of metal products manufacturing sales and distribution of steel and iron products and steel service centre.

HUAYANG – Stock Code 5062
• HUAYANG jumped an impressive 6.5 sen (10.4% to RM0.69) yesterday, accompanied by exceptional trading volumes.
• Share is now potentially showing signs of bottoming-out after hitting a “double-bottom” in December last year.
• Over the past 1-2 months, MACD has been creeping upwards despite sideways movement of the share price – thus signalling an underlying build-up in momentum.
• Expect follow-through buying from here, with resistances at RM0.74 (R1) and RM0.83 (R2). Conversely, firm downside support can be identified at low of RM0.595 (S1).
source: Kenanga Research – 16/01/2018
Above: Salute daily chart (click to enlarge view)

SALUTE has experienced a flag- - formation breakout above the RM1.35 level with improved volumes. The MACD Histogram has extended another green bar, while the RSI remains above 50. Price may rally, targeting the RM1.42- - RM1.50 levels. Support will be set around the RM1.30 level.
source: Malacca Securities Research – 29/12/2017
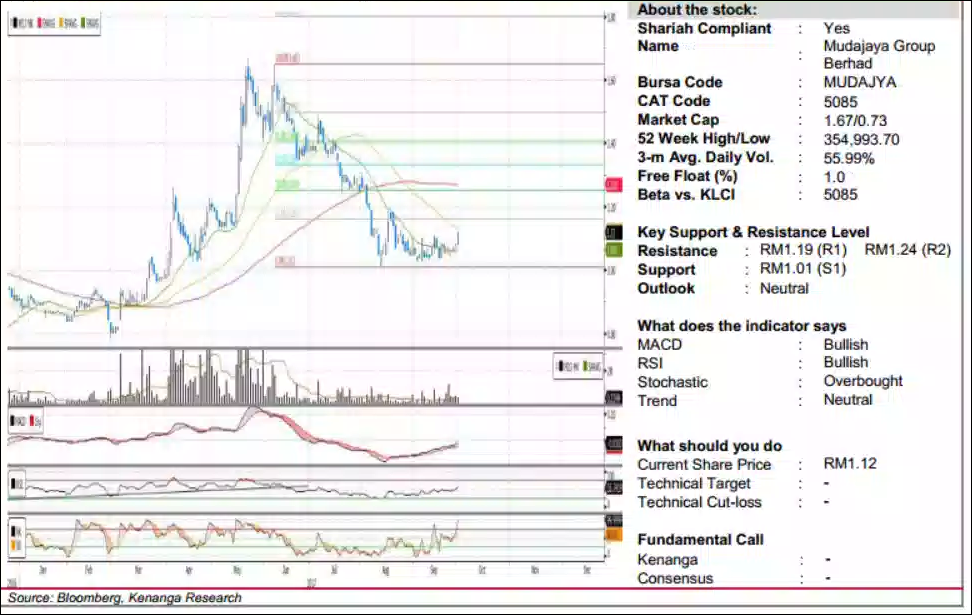
MUDAJYA gained 4 sen (3.7%) yesterday to close at RM1.12, bucking the trend to stage a significant break-above from its downward consolidation trend since early-June. Coupled with positive uptrends in key indicators since its low on 11-Aug, yesterday’s move may potentially be indicative of a larger reversal play.
Another encouraging note is the weak trading volumes during its downtrend, as compared to strong volumes during its prior uptrend from Feb to May, thus suggesting more a positively biased sentiment as an underlying support for the share. From here, sustained momentum would see the share move towards its overhead resistances at RM1.19 (R1) and RM1.24 (R2). Conversely, a firm support can be found at its low of RM1.01 (S1).
source: Kenanga Research - 3/10/2017
MUDAJAYA GROUP BERHAD
The principal activity of the Company is that of investment holding. The principal activities of the subsidiary companies are civil engineering and building construction hire of plant and machinery manufacturing supplying and trading of construction related materials and housing project management and development.
EATECH’s share price rose an impressive 2.5 sen (5.8%) yesterday, closing at RM0.455 on the back of exceptionally healthy trading volume, with 5.2m shares exchanging hands - equivalent to around 2.6x of its daily average. Yesterday’s move can be interpreted as a breakout from its previous resistance of RM0.435-0.445, potentially signalling a reversal after its long downtrend since March. Likewise, a “Golden Crossover” had emerged between its 20-day and 50-day SMAs, with key-indicators also showing positive signs – MACD rising above zero and Signal line, while RSI continues its uptrend. We believe that combined, these are good indicatives of a move higher. From here, sustained followthrough should see the share having a clear path towards overhead resistances at RM0.49 (R1) and RM0.53 (R2). Conversely, a decisive break-below its aforementioned resistance-turned-support of RM0.435-0.445 (S1) is deemed as highly negative, with the share potentially capitulating back towards its low at RM0.35 (S2).
source: Kenanga Research - 20/09/2017
E.A. TECHNIQUE (M) BERHAD
The Group are principally an owner and operator of marine vessels where the business is focused on marine transportation and offshore storage of O&G and the provision of port marine services.
Stock Code: 0049
source: Malacca Securities Research – 21/08.2017
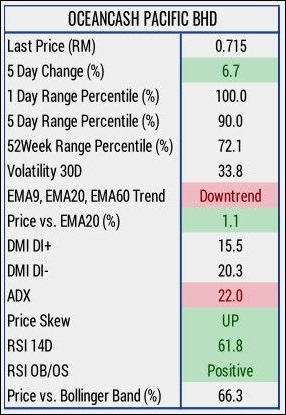
OCEANCASH PACIFIC BERHAD
The Company is mainly an investment holding company. Its subsidiaries are engaged in manufacturing and distribution of resinated felt; manufacturing and trading of thermo-bonded nonwoven cloth.
PWF CONSOLIDATED Stock Code 7134

Support will be pegged around the RM1.01 level.
source: Malacca Securities Research – 16/08/2017
PWF CONSOLIDATED BERHAD
The Group is principally involved in the manufacture and sale of broiler feeds and in the farming of broiler chicks.

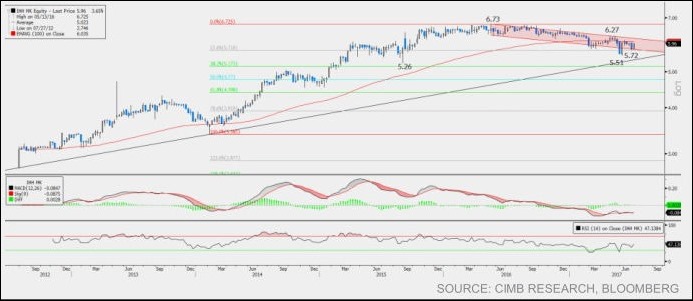
Any price dips on Axiata towards the lower Bollinger band (RM4.56) should be attractive to bargain for rebound upside to RM4.90, with the 38.2%FR (RM5.15) and 50%FR (RM5.48) acting as tougher resistance. Crucial support is from the 29/11/16 low (RM4.11)
Axiata Daily Chart:
source: TA Securities – 26/7/2017
AXIATA GROUP BERHAD
The Group's mobile subsidiaries and associates operate under the brand name ‘Celcom’ in Malaysia ‘XL’ in Indonesia ‘Dialog’ in Sri Lanka ‘AKTEL’ in Bangladesh ‘HELLO’ in Cambodia ‘Idea’ and ‘Spice’ in India ‘M1’ in Singapore and ‘MTCE’ in Iran (Esfahan).



SEAL INCORPORATED BHD Stock Code: 4286

Despite recent consolidation, SEAL has been able to hold on above its critical supports of 60-day & 200-day EMA lines as well as the “Ichimoku Cloud”. Banking on improving momentum,
we expect SEAL to form another up-leg in the near-term. Upper resistance is pegged at MYR0.54 and MYR0.635.
source: Maybank IB Research – 10/04/2017
SEAL INCORPORATED BERHAD
The principal activities of the Company are property investment and contractor of buildings and project manager for property development. The principal activities of the subsidiaries are the extraction of timber trading of log and sawmilling and letting of properties.
TECFAST has been consolidating over the past week after a prior strong two-week rally. Yesterday, the share price surged 6.5 sen (19.4%) to close at RM0.40 to confirm a bullish ‘Flag’ chart pattern with a long white ‘ Marubozu’ candlestick. The MACD line is poised to form a higher high on the back of strong uptick in RSI and Stochastic, laying a hand on the bullish bias. In tandem with the strong trading volume observed, we view that follow-through buying interest could rally the stock further up towards RM0.40 (R1) and possibly RM0.50 (R2) in the near-to-mid term, based on the flagpole measurement objective. On a side note, we do not discount the possibility of the share price taking a breather soon before resuming its uptrend given the overbought condition displayed by the RSI and Stochastic. That said, we note key support levels are found at RM0.335 (S1) followed by RM0.295 (S2).
Source: Kenanga Research – 29/3/2017
TECHFAST HOLDINGS BERHAD
The Company is a leading specialized manufacturer and distributor of High Precision Computer's Components (self-clinching fasteners)
JCY Target Price RM0.71.
JCY Daily Chart (click to enlarge):
JCY saw its share price climbing 2.5 sen (4.03%) to close at RM0.645 on strong trading volume. The bullish price action yesterday has led the share price to break out from its 1.5-month consolidation phase while settling above all its key SMA trend lines. MACD line is looking to stage a bullish crossover above its signal line to lend a hand on the bullish-bias outlook ahead, while positive uptick in daily RSI is indicating improved buying interest on the stock. From here, we reckon the immediate-term outlook to be biased to the upside, where a swift recapture of the immediate resistance level of RM0.655 (R1) would see the stock gear towards our target price objective of RM0.71 (3 bids below our measurement objective of RM0.725 (R2)). Key support levels to note are RM0.62 (S1)/RM0.58 (S2), where our conservative stop-loss level is placed at RM0.595 (3 bids below S1).
source: Kenanga Research – 14/3/2017
JCY INTERNATIONAL BERHAD
The company currently engaged in business of design and development of hard disk drive (HDD) and other technology-related activities.